

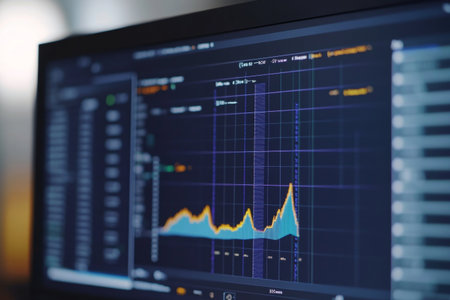
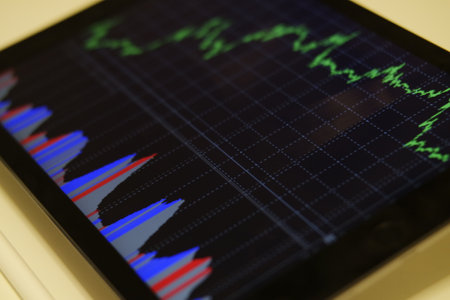
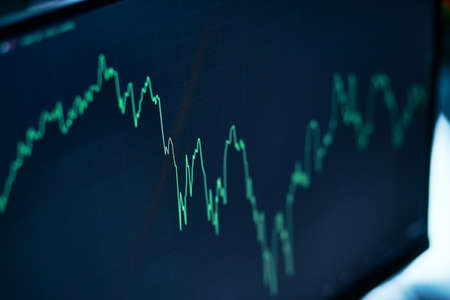
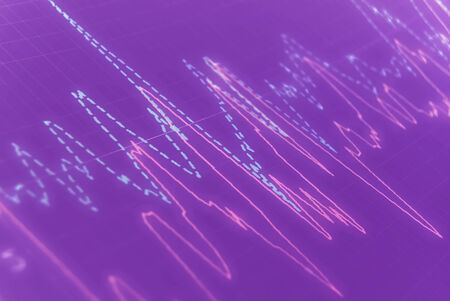
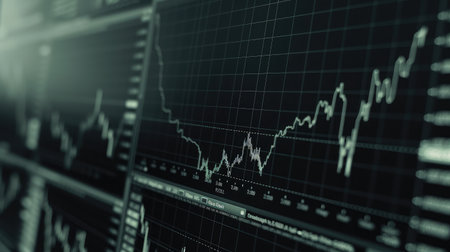
Shallow depth of field (selective focus) with details of a chart showing the stock market crash from March 2020 due to the Covid-19 pandemic on a computer screen (S&P500 index)
Коллекция по умолчанию
Коллекция по умолчанию
Создать новую
A close-up of a high-resolution computer screen reveals a detailed Python script focused on data cleaning and preprocessing techniques for data analysis.
Коллекция по умолчанию
Коллекция по умолчанию
Создать новую
Color grading graph or RGB colour correction indicator on monitor in post production process. Telecine stage in video or film production processing. for colorist edit or adjust color on digital movie.
Коллекция по умолчанию
Коллекция по умолчанию
Создать новую

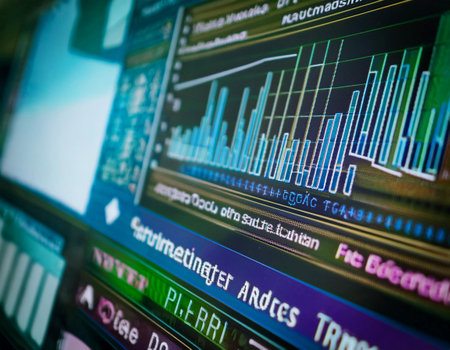
Color grading monitor. RGB colour correction indicator graph on screen in post production process. Telecine stage in video or film production processing. for colorist edit or adjust on digital movie.
Коллекция по умолчанию
Коллекция по умолчанию
Создать новую

Stock market graph on screen. Ticker on monitor screen. Investing, Finance and Economic concept. Shallow depth of field.
Коллекция по умолчанию
Коллекция по умолчанию
Создать новую

Color grading graph or RGB colour correction indicator on monitor in post production process. Telecine stage in video or film production processing. for colorist edit or adjust color on digital movie.
Коллекция по умолчанию
Коллекция по умолчанию
Создать новую
A close-up view of an electrocardiogram ECG monitor displaying a heart wave pattern, with vibrant lines showing the rhythm of a beating heart against a dark background
Коллекция по умолчанию
Коллекция по умолчанию
Создать новую
Business chart with line graph, bar chart and numbers on dark background, 3d rendering. Computer digital drawing.
Коллекция по умолчанию
Коллекция по умолчанию
Создать новую

image of the financial graph on a computer monitor.
Коллекция по умолчанию
Коллекция по умолчанию
Создать новую
charts oil rig data
Коллекция по умолчанию
Коллекция по умолчанию
Создать новую
Grow Stock market trading graph in graphic concept.financial investment or economic trends business design. Abstract finance background.Low angle shot.
Коллекция по умолчанию
Коллекция по умолчанию
Создать новую
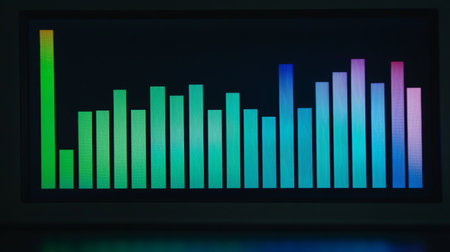
Captivating audio visualizer display showcasing vibrant bars in a spectrum of colors, illustrating the dynamic relationship between sound and visuals in a modern design.
Коллекция по умолчанию
Коллекция по умолчанию
Создать новую
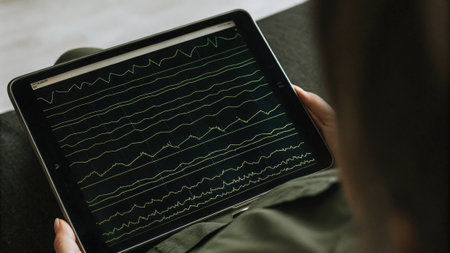
A closeup of the EEG sensor interface displaying realtime brainwave data on a tablet screen showing spikes and waves as the user meditates with the sensor visibly attached to their.
Коллекция по умолчанию
Коллекция по умолчанию
Создать новую
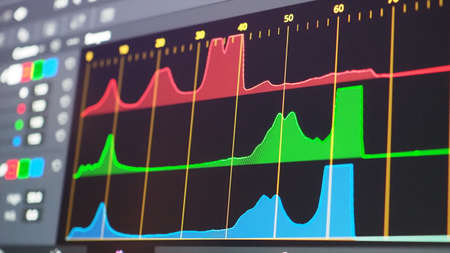
Color grading graph or RGB colour correction indicator on monitor in post production process. Telecine stage in video or film production processing. for colorist edit or adjust color on digital movie.
Коллекция по умолчанию
Коллекция по умолчанию
Создать новую

Color grading monitor. RGB colour correction indicator graph on screen in post production process. Telecine stage in video or film production processing. for colorist edit or adjust on digital movie.
Коллекция по умолчанию
Коллекция по умолчанию
Создать новую
Audio Visual Media, Brightly Colored Sound Spectrum and Waves, Broadcasting Background
Коллекция по умолчанию
Коллекция по умолчанию
Создать новую
Currency growth chart online. Phone with a schedule. financial concept. 3d rendering.
Коллекция по умолчанию
Коллекция по умолчанию
Создать новую

image is a graph of financial development on a computer monitor.
Коллекция по умолчанию
Коллекция по умолчанию
Создать новую
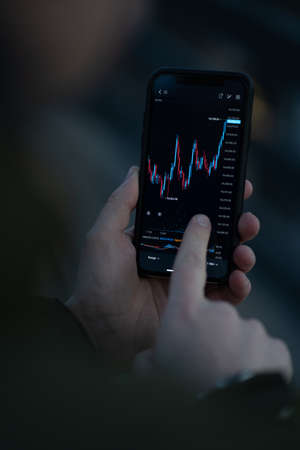
Trader checking stock market data in mobile app for trading online. Male hand touching smartphone screen with real time forex chart, reading financial news and analyzing price flow, selective focus
Коллекция по умолчанию
Коллекция по умолчанию
Создать новую
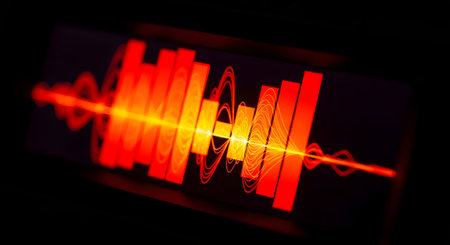
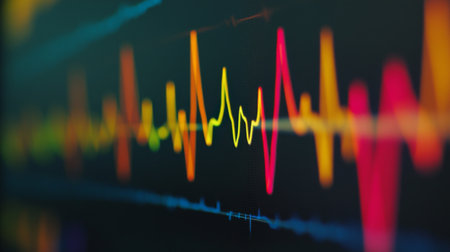
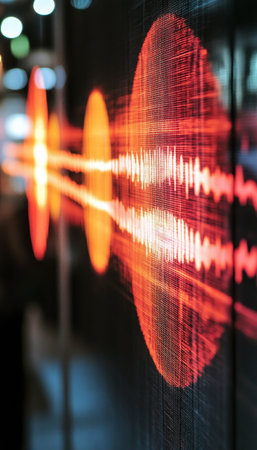
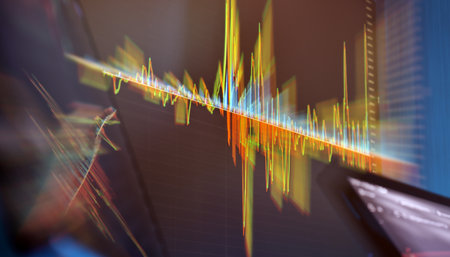
A close-up, dynamic shot of a glowing red and orange audio waveform and graphic equalizer on a digital screen. The image visually represents sound, frequency, and amplitude, capturing the energy of music or voice. It's an ideal visual for topics related to audio engineering, music production, podcasts, and sound technology.
Коллекция по умолчанию
Коллекция по умолчанию
Создать новую
Stock market data on LED display. Abstract stock market data on LED display.
Коллекция по умолчанию
Коллекция по умолчанию
Создать новую
Black and white image of stock market charts showing price trends and fluctuations on digital display with financial data for analysis and review
Коллекция по умолчанию
Коллекция по умолчанию
Создать новую
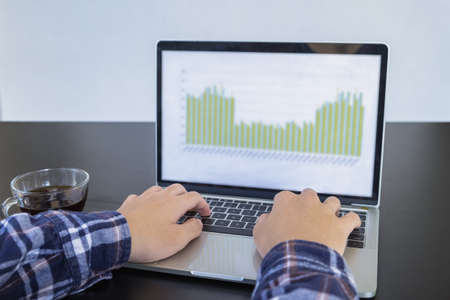
Laptop with the chart on screen. Business and finance concept
Коллекция по умолчанию
Коллекция по умолчанию
Создать новую
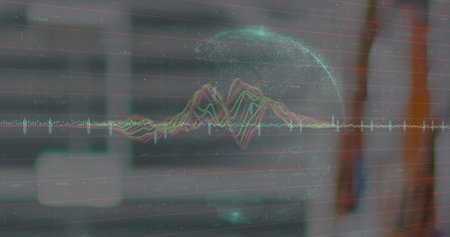
Image of data processing over empty warehouse.
Коллекция по умолчанию
Коллекция по умолчанию
Создать новую
Screen with stock market index charts and diagrams - ai
Коллекция по умолчанию
Коллекция по умолчанию
Создать новую

A close-up, angled shot of a vibrant digital audio spectrum analyzer on a screen. The colorful bars, forming a rainbow gradient from blue to pink, represent different sound frequencies and amplitudes, visualizing music, sound waves, or data analysis.
Коллекция по умолчанию
Коллекция по умолчанию
Создать новую
Big data and communication. Internet and data analysis on the web. Teamwork and IT software programming.3d illustration.
Коллекция по умолчанию
Коллекция по умолчанию
Создать новую
Stock Market Loss Trading Chart Investment Analysis Business Index Chart Finance Board Chart
Коллекция по умолчанию
Коллекция по умолчанию
Создать новую
Audio sound wave studio editing computer program screen showings sounds on screen from vocal recording of voiceover.
Коллекция по умолчанию
Коллекция по умолчанию
Создать новую
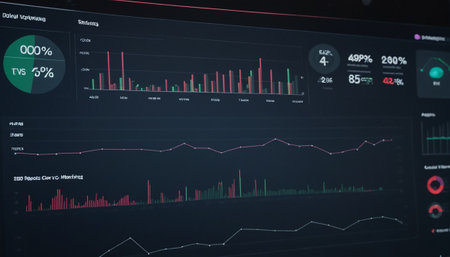
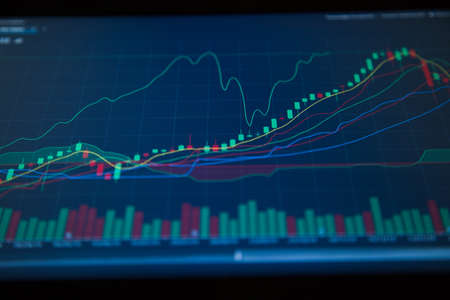
Digital Finance: Analyzing Volatile Market Graphs and Managing Tiered Compensation Schedules on a Desktop.
Коллекция по умолчанию
Коллекция по умолчанию
Создать новую
Abstract technology background with wireframe grid and blurred lines on dark. Visual presentation of analysis research. Computing concept. Banner for business, science and technology. Big Data.
Коллекция по умолчанию
Коллекция по умолчанию
Создать новую
graph paper with financial diagram
Коллекция по умолчанию
Коллекция по умолчанию
Создать новую
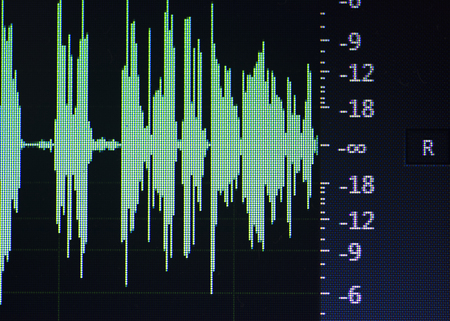
Display of the professional video recorder with alarm Over signal. Too loud sound level
Коллекция по умолчанию
Коллекция по умолчанию
Создать новую
Apple iPhone 6s with Apple Music app on the screen. iPhone 6s was created and developed by the Apple inc.
Коллекция по умолчанию
Коллекция по умолчанию
Создать новую
Color grading graph or RGB colour correction indicator on monitor in post production process. Telecine stage in video or film production processing. for colorist edit or adjust color on digital movie.
Коллекция по умолчанию
Коллекция по умолчанию
Создать новую
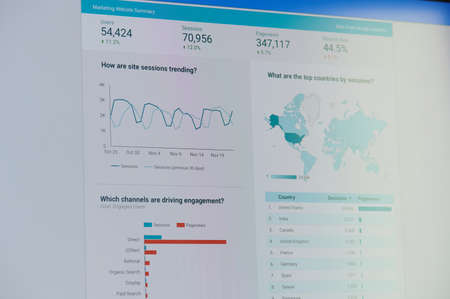
New york, USA - November 24, 2020: Google ads marketing website summarydashboard on laptop screen
Коллекция по умолчанию
Коллекция по умолчанию
Создать новую
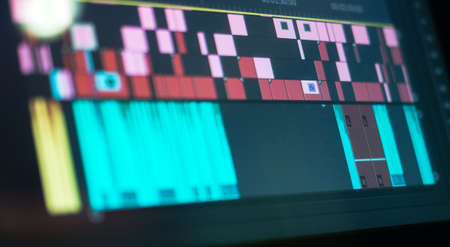
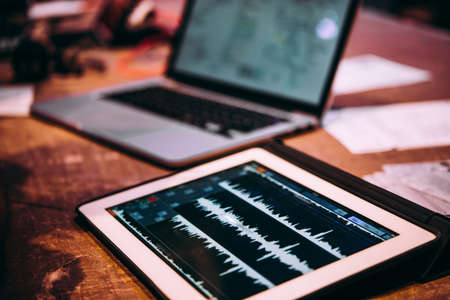
video editting timeline
Коллекция по умолчанию
Коллекция по умолчанию
Создать новую
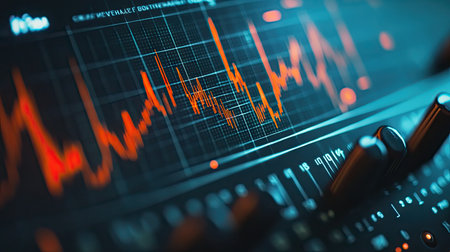
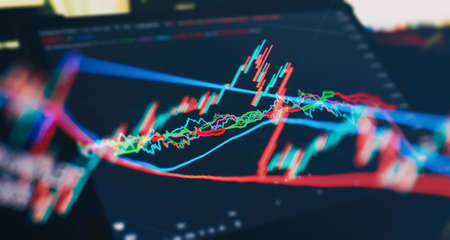
Dynamic close-up of a colorful financial chart with motion blur effect, symbolizing market volatility, trading speed, and data intensity.
Коллекция по умолчанию
Коллекция по умолчанию
Создать новую
Close up image of content displayed on a digital screen, representing digital media, information sharing, and online communication.
Коллекция по умолчанию
Коллекция по умолчанию
Создать новую
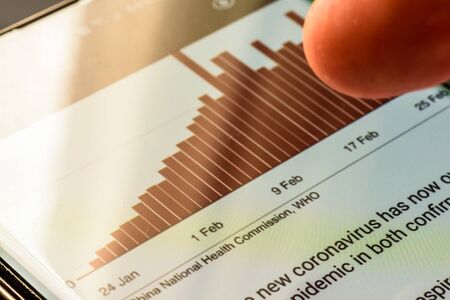
coronavirus covid 19 graph on smart phone screen - Northampton, UK - February 25, 2020
Коллекция по умолчанию
Коллекция по умолчанию
Создать новую

Business chart with line graph, bar chart and numbers on dark background, 3d rendering. Computer digital drawing.
Коллекция по умолчанию
Коллекция по умолчанию
Создать новую
Medium shot of a closeup on charts and graphs illustrating loan interest rate fluctuations over time
Коллекция по умолчанию
Коллекция по умолчанию
Создать новую
Discussing data woman in blazer, two men studying laptop at meeting table, with line graph overlay. Business, teamwork, corporate, analysis, modern, collaboration, skyline
Коллекция по умолчанию
Коллекция по умолчанию
Создать новую
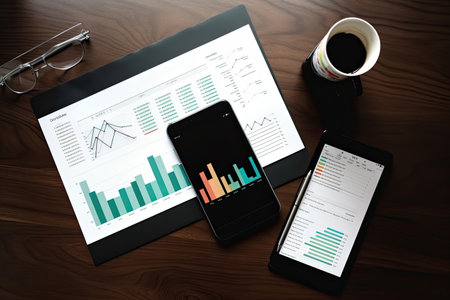
Smartphone and Tablet pc with financial charts and graphs on office desk, business concept
Коллекция по умолчанию
Коллекция по умолчанию
Создать новую
Color grading monitor. RGB colour correction indicator graph on screen in post production process. Telecine stage in video or film production processing. for colorist edit or adjust on digital movie.
Коллекция по умолчанию
Коллекция по умолчанию
Создать новую
Stock market graph on tablet screen, stock market data on mobile phone
Коллекция по умолчанию
Коллекция по умолчанию
Создать новую

A statistical report with a diagram lies on the table
Коллекция по умолчанию
Коллекция по умолчанию
Создать новую
Learn online, Student watching lesson online and studying from home. Young man taking notes while looking at computer screen following professor on video call. Studying from home on pc.
Коллекция по умолчанию
Коллекция по умолчанию
Создать новую
close-up of the robot control panel at the exhibition
Коллекция по умолчанию
Коллекция по умолчанию
Создать новую
Making music using modern software. Electronic music and professional music equipment concept.
Коллекция по умолчанию
Коллекция по умолчанию
Создать новую
graph of financial growth on a computer monitor.
Коллекция по умолчанию
Коллекция по умолчанию
Создать новую
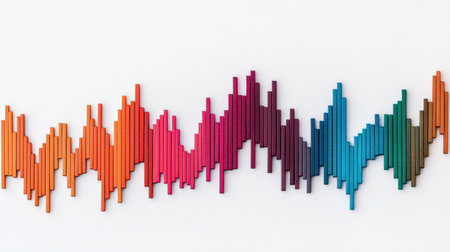
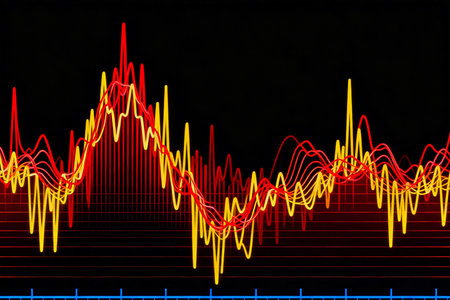
A vibrant soundwave graphic featuring colorful peaks and valleys, representing audio frequencies in an artistic style.
Коллекция по умолчанию
Коллекция по умолчанию
Создать новую
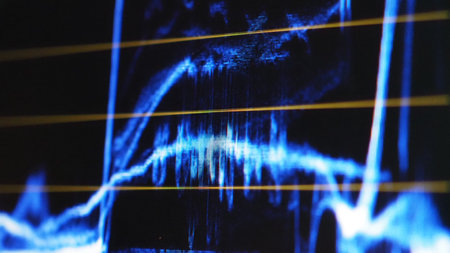
Close-up of an oscilloscope displaying a detailed electrical waveform, with a focus on the signal's amplitude and frequency -
Коллекция по умолчанию
Коллекция по умолчанию
Создать новую
Stock market data on monitor. Financial graph on monitor. Stock market data on monitor. Stock market data on monitor. Business graph on monitor. Stock market data on monitor.
Коллекция по умолчанию
Коллекция по умолчанию
Создать новую

Financial data processing over cityscape against dark background. global finance and digital interface technology concept
Коллекция по умолчанию
Коллекция по умолчанию
Создать новую
Detailed view of a graph displayed on a digital screen, showing trend analysis for website traffic flow, Incorporate trend analysis for website traffic fluctuations
Коллекция по умолчанию
Коллекция по умолчанию
Создать новую
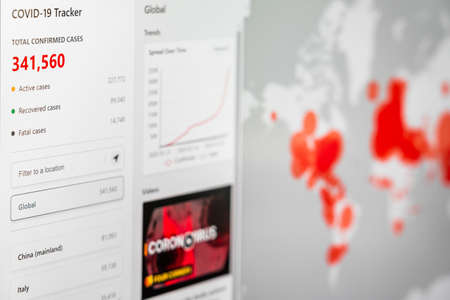
BUCHAREST, ROMANIA - MARCH 23, 2020: Coronavirus Total Cases Of The Pandemic Spreading All Around The Globe In March
Коллекция по умолчанию
Коллекция по умолчанию
Создать новую

Close-up of the curve on the medical monitor
Коллекция по умолчанию
Коллекция по умолчанию
Создать новую
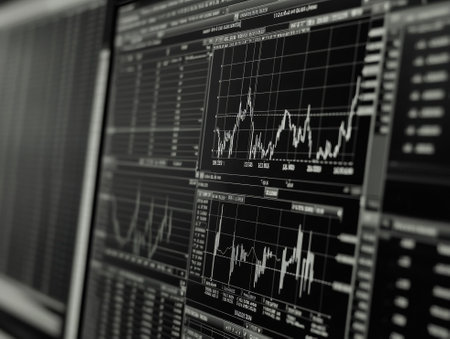
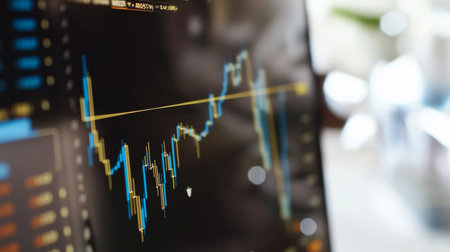
Close-up of monitor with stock market chart. Stock market concept
Коллекция по умолчанию
Коллекция по умолчанию
Создать новую
Color grading graph or RGB colour correction indicator on monitor in post production process. Telecine stage in video or film production processing. for colorist edit or adjust color on digital movie.
Коллекция по умолчанию
Коллекция по умолчанию
Создать новую

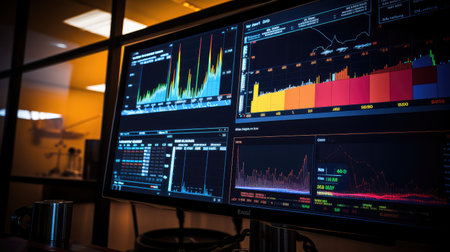
Financial charts diagram stock market data analysis concept on virtual screen
Коллекция по умолчанию
Коллекция по умолчанию
Создать новую
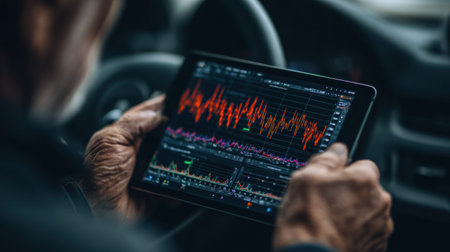
Individual holds a tablet displaying collapsing dashboard data while seated in a dark environment. The focus is on data analysis.
Коллекция по умолчанию
Коллекция по умолчанию
Создать новую
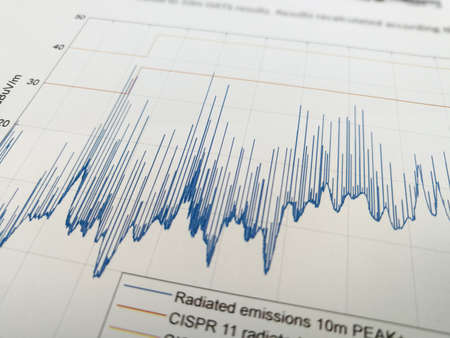
Radiated emissions spectrogram with limit lines in EMC electromagnetic compatibility test report
Коллекция по умолчанию
Коллекция по умолчанию
Создать новую

A close-up of a digital dashboard with rising investments, offering space for adding content about investment performance, growth, or risk management
Коллекция по умолчанию
Коллекция по умолчанию
Создать новую
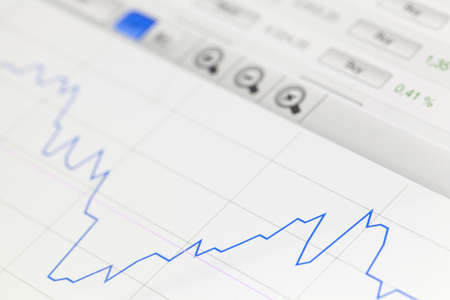
securities price chart on the monitor screen
Коллекция по умолчанию
Коллекция по умолчанию
Создать новую
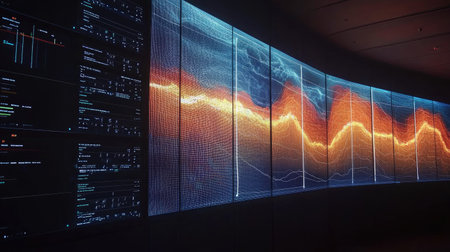
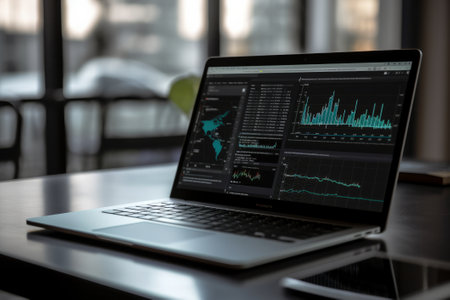
This image showcases a modern digital data visualization environment, featuring colorful graphs on multiple screens, reflecting trends, patterns, and coding interfaces.
Коллекция по умолчанию
Коллекция по умолчанию
Создать новую
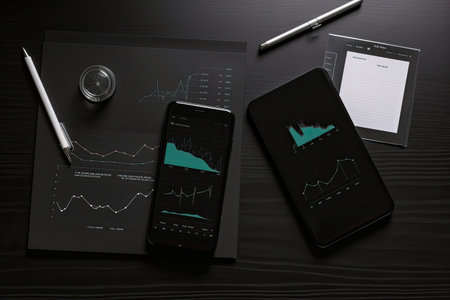
Smartphone and Tablet pc with financial charts and graphs on office desk, business concept
Коллекция по умолчанию
Коллекция по умолчанию
Создать новую
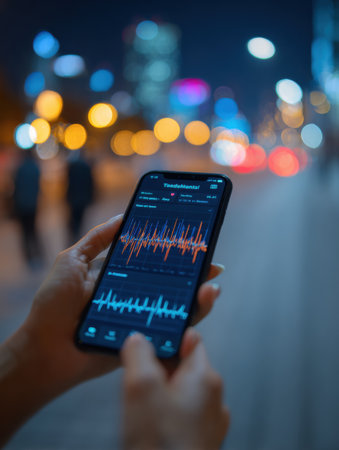
Person holds a smartphone displaying colorful data graphs, illuminated city lights create a lively backdrop during nighttime, showcasing urban energy.
Коллекция по умолчанию
Коллекция по умолчанию
Создать новую
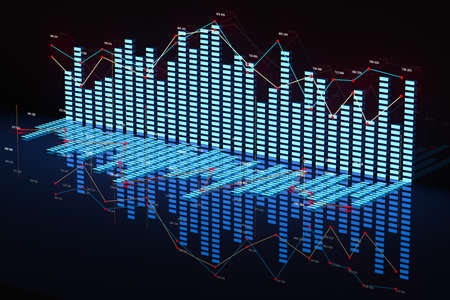
A dark digital display multiple rows of financial data presented as bar graphs and line charts. The graphs are primarily in shades of teal and green, with some rows featuring orange accents. Text labels and numerical data are visible in a futuristic font.
Коллекция по умолчанию
Коллекция по умолчанию
Создать новую
A close-up of a smartphone displaying a business finance dashboard, providing space for adding financial tips, investment advice, or business growth strategies
Коллекция по умолчанию
Коллекция по умолчанию
Создать новую
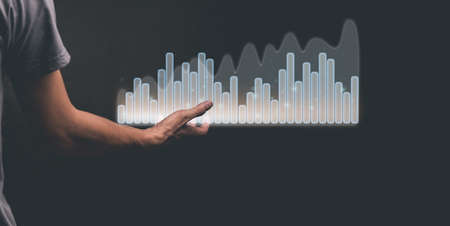
man showing bar graph stock graph investment hologram on hand
Коллекция по умолчанию
Коллекция по умолчанию
Создать новую
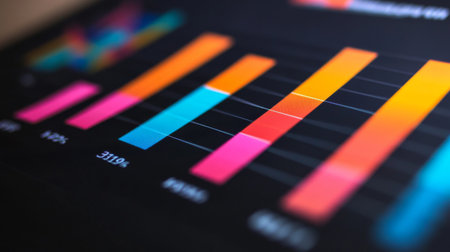
Financial graphic chart
Коллекция по умолчанию
Коллекция по умолчанию
Создать новую

video editting timeline
Коллекция по умолчанию
Коллекция по умолчанию
Создать новую
Business chart with line graph, bar chart and numbers on dark background, 3d rendering. Computer digital drawing.
Коллекция по умолчанию
Коллекция по умолчанию
Создать новую
Abstract technology background with wireframe shiny grid and blurred lines on dark. Visual presentation of analysis research algorithms. Computing concept. Banner for business, science and technology. Big Data.
Коллекция по умолчанию
Коллекция по умолчанию
Создать новую
graph paper with financial diagram
Коллекция по умолчанию
Коллекция по умолчанию
Создать новую
A stock market graph on a black background.
Коллекция по умолчанию
Коллекция по умолчанию
Создать новую

Glitching music frequencies with vibrant abstract background and edgy elements
Коллекция по умолчанию
Коллекция по умолчанию
Создать новую
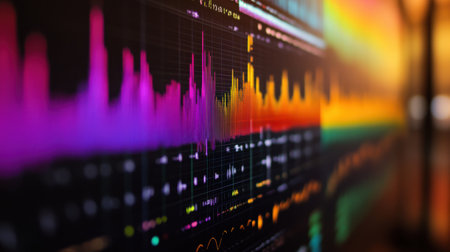
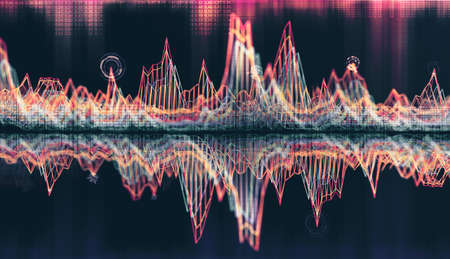
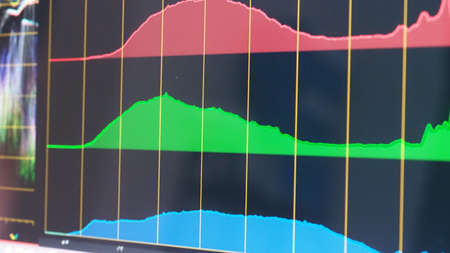
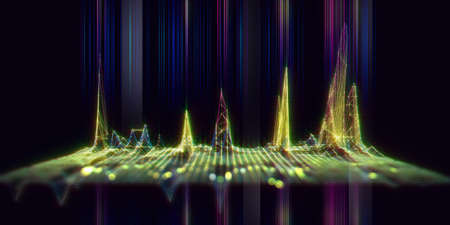
This image features a detailed digital representation of colorful wave graphs. The composition presents data visualization with vibrant hues, sharp lines, and a dark background. It might be suitable for representing complex data analysis, technological advancements, or scientific illustrations, with potential uses in various commercial projects.
Коллекция по умолчанию
Коллекция по умолчанию
Создать новую
A close-up of a business bar chart on a smartphone, displaying a breakdown of monthly profits.
Коллекция по умолчанию
Коллекция по умолчанию
Создать новую
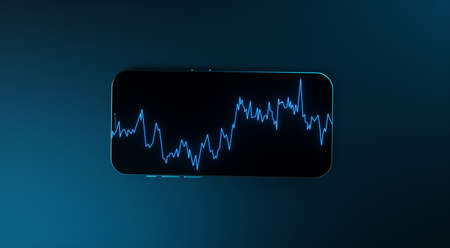
smartphone with stock market graph on screen, business and technology concept
Коллекция по умолчанию
Коллекция по умолчанию
Создать новую
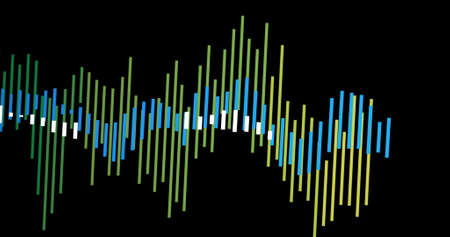
Image of financial data processing on black background. global business, finances, connections and digital interface concept digitally generated image.
Коллекция по умолчанию
Коллекция по умолчанию
Создать новую
A high-resolution image of a stock market graph on a computer screen.
Коллекция по умолчанию
Коллекция по умолчанию
Создать новую
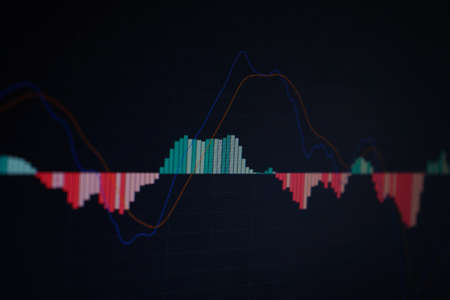
Displaying waveform chart on shaded wall with red grid lines, teal candlestick markers, axis labels. Data, visualization, infographics, analytics, digital, modern, technology
Коллекция по умолчанию
Коллекция по умолчанию
Создать новую
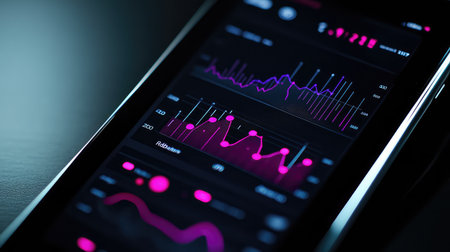
A close-up of a smartphone screen showing a financial app with graphs tracking investment performance and market trends.
Коллекция по умолчанию
Коллекция по умолчанию
Создать новую
Geologist pointing at colorful seismic waves displayed on an interactive touch screen, studying geological data for earthquake prediction and analysis
Коллекция по умолчанию
Коллекция по умолчанию
Создать новую
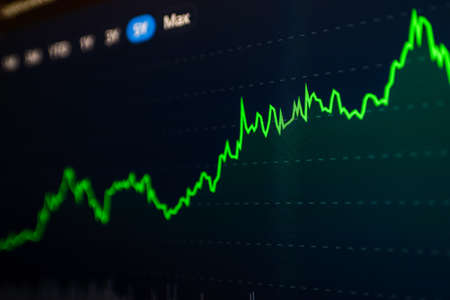
Financial chart with uptrend line close-up, stock market on the screen, business background photo
Коллекция по умолчанию
Коллекция по умолчанию
Создать новую
A close-up of a financial dashboard with growth charts and profit reports, providing space to add insights on economic growth, investment strategies, or market expansion
Коллекция по умолчанию
Коллекция по умолчанию
Создать новую
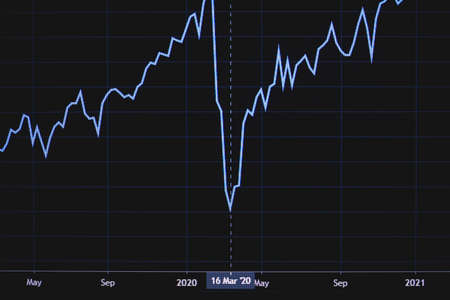
Shallow depth of field (selective focus) with details of a chart showing the stock market crash from March 2020 due to the Covid-19 pandemic on a computer screen (S&P500 index)
Коллекция по умолчанию
Коллекция по умолчанию
Создать новую
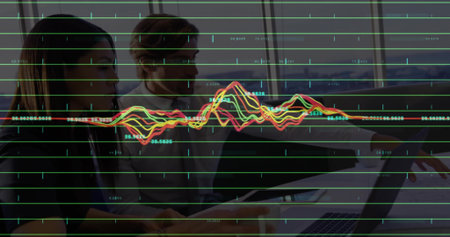
Woman in long-sleeve top reviewing spreadsheet at desk with laptop tablet green waveform overlay. Professional, analysis, minimalistic, technology, workspace, data, productivity
Коллекция по умолчанию
Коллекция по умолчанию
Создать новую

Financial graphs analysis and pen.
Коллекция по умолчанию
Коллекция по умолчанию
Создать новую
A detailed close-up of a laptop screen showcasing a data visualization graph in red tones, ideal for business, finance, and technology themes.
Коллекция по умолчанию
Коллекция по умолчанию
Создать новую
Close-up Of Person's Hand Holding Digital Tablet With Graph On Screen
Коллекция по умолчанию
Коллекция по умолчанию
Создать новую
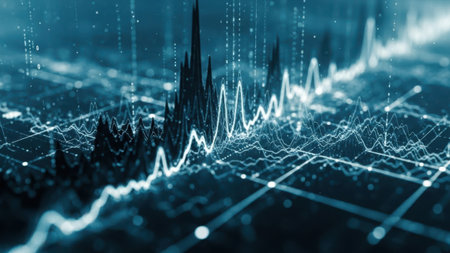
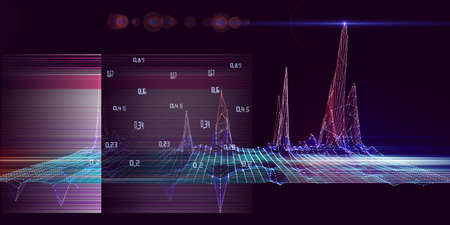
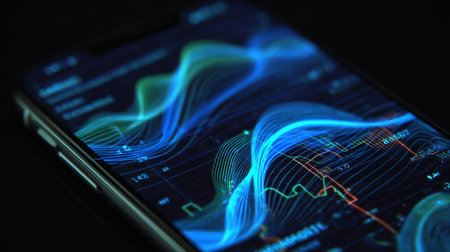
A detailed prompt for this image would be: 'An abstract, futuristic digital visualization of data. The scene is dominated by glowing, intricate lines and nodes, forming a complex network. Prominent vertical structures, resembling skyscrapers or data towers, rise from the grid. The overall aesthetic is dark and technological, with a dominant cool blue and teal color palette. The lines suggest movement and growth, with sharp peaks and valleys, evoking a sense of financial markets, stock charts, or technological advancement. The depth of field is shallow, with some elements in sharp focus and others blurred, creating a sense of dynamism and immersion. The lighting is ethereal and artificial, highlighting the digital nature of the representation.'
Коллекция по умолчанию
Коллекция по умолчанию
Создать новую
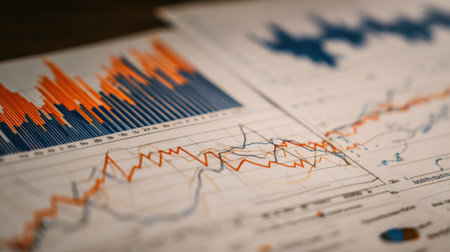
Close-up of a financial graph on a computer screen, showcasing upward and downward trends with detailed line and bar charts.
Коллекция по умолчанию
Коллекция по умолчанию
Создать новую
Business statistics and Analytics value . Abstract glowing forex chart interface background. Investment, trade, stock, finance and analysis concept.
Коллекция по умолчанию
Коллекция по умолчанию
Создать новую
Sound wave on black background. Music equalizer technology. Sound wave.
Коллекция по умолчанию
Коллекция по умолчанию
Создать новую
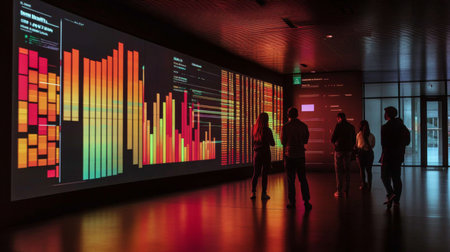
A modern office space featuring vibrant data visualizations, showcasing colorful charts and graphs. A group of people engaging with digital content, demonstrating teamwork and innovation.
Коллекция по умолчанию
Коллекция по умолчанию
Создать новую
Stock Market Chart on Blue Background. share drop down and stock up
Коллекция по умолчанию
Коллекция по умолчанию
Создать новую
Vibrant bar graph displayed on a digital screen, showcasing data insights and trends for business analysis. Ideal for presentations and reports.
Коллекция по умолчанию
Коллекция по умолчанию
Создать новую
Legion-Media
Создайте свои проекты на основе качественных стоковых фотографий и видео.


Copyright © Legion-Media.